Data Model
The data model in Orcablue is a semantic layer that helps the platform understand and organize your data. By providing a clear structure of your data’s metadata, the data model allows you to explore how datasets, tables, and relationships are configured, enabling efficient and accurate data analysis.

Understanding Data Model
The data model serves as a blueprint of your data architecture, displaying how various datasets are interconnected. The model organizes your data into a hierarchical structure, making it easy to explore relationships between tables, metrics, and entities.
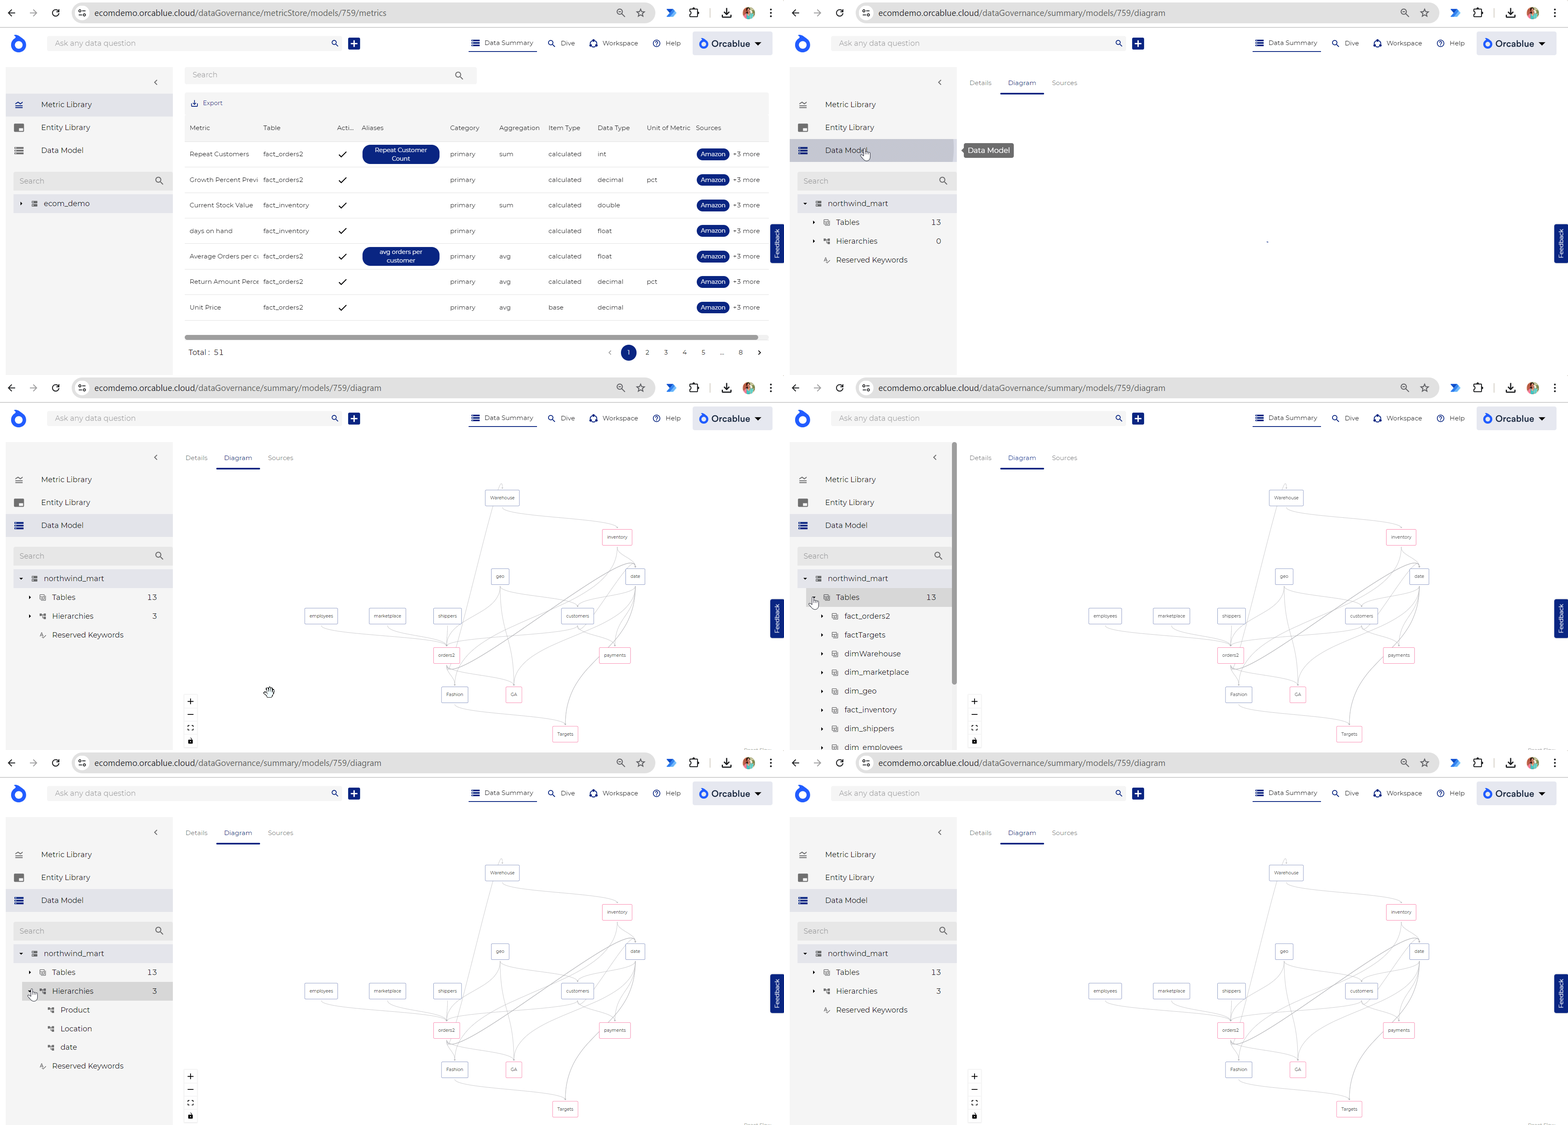
You can view the data model through the left-hand navigation bar, where you will find a visual representation of the data’s structure. This view offers a high-level understanding of how different components are linked together.
Sections
- Data Model Diagram - The data model diagram is a visual representation that shows how different tables and datasets within your platform are connected. It helps you understand the relationships between tables and the flow of data.
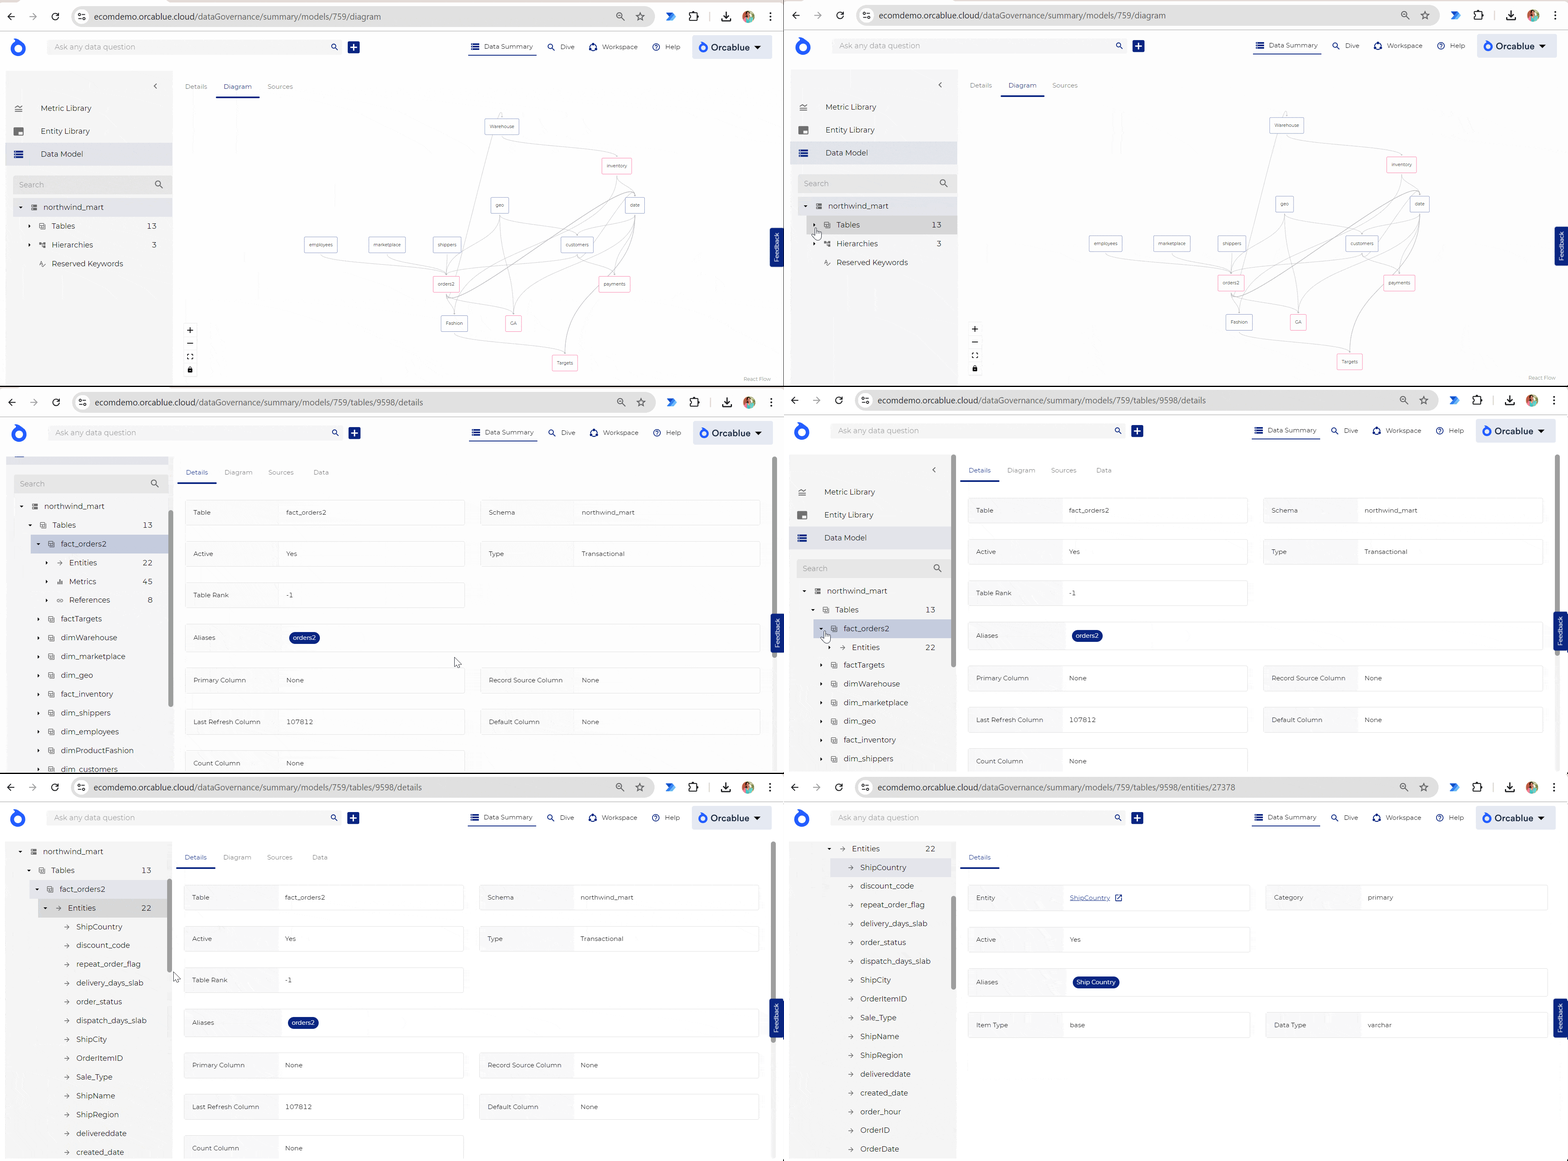
- Tables - A table represents any dataset within the Data Model. Each table contains data related to a specific area of your business process, such as sales, customer information, or financial metrics.
- Relationships - Relationships define the connections between datasets or tables in the Data Model. For instance, relationships link a table of customer data to a table of sales data, allowing for comprehensive cross-table analysis.
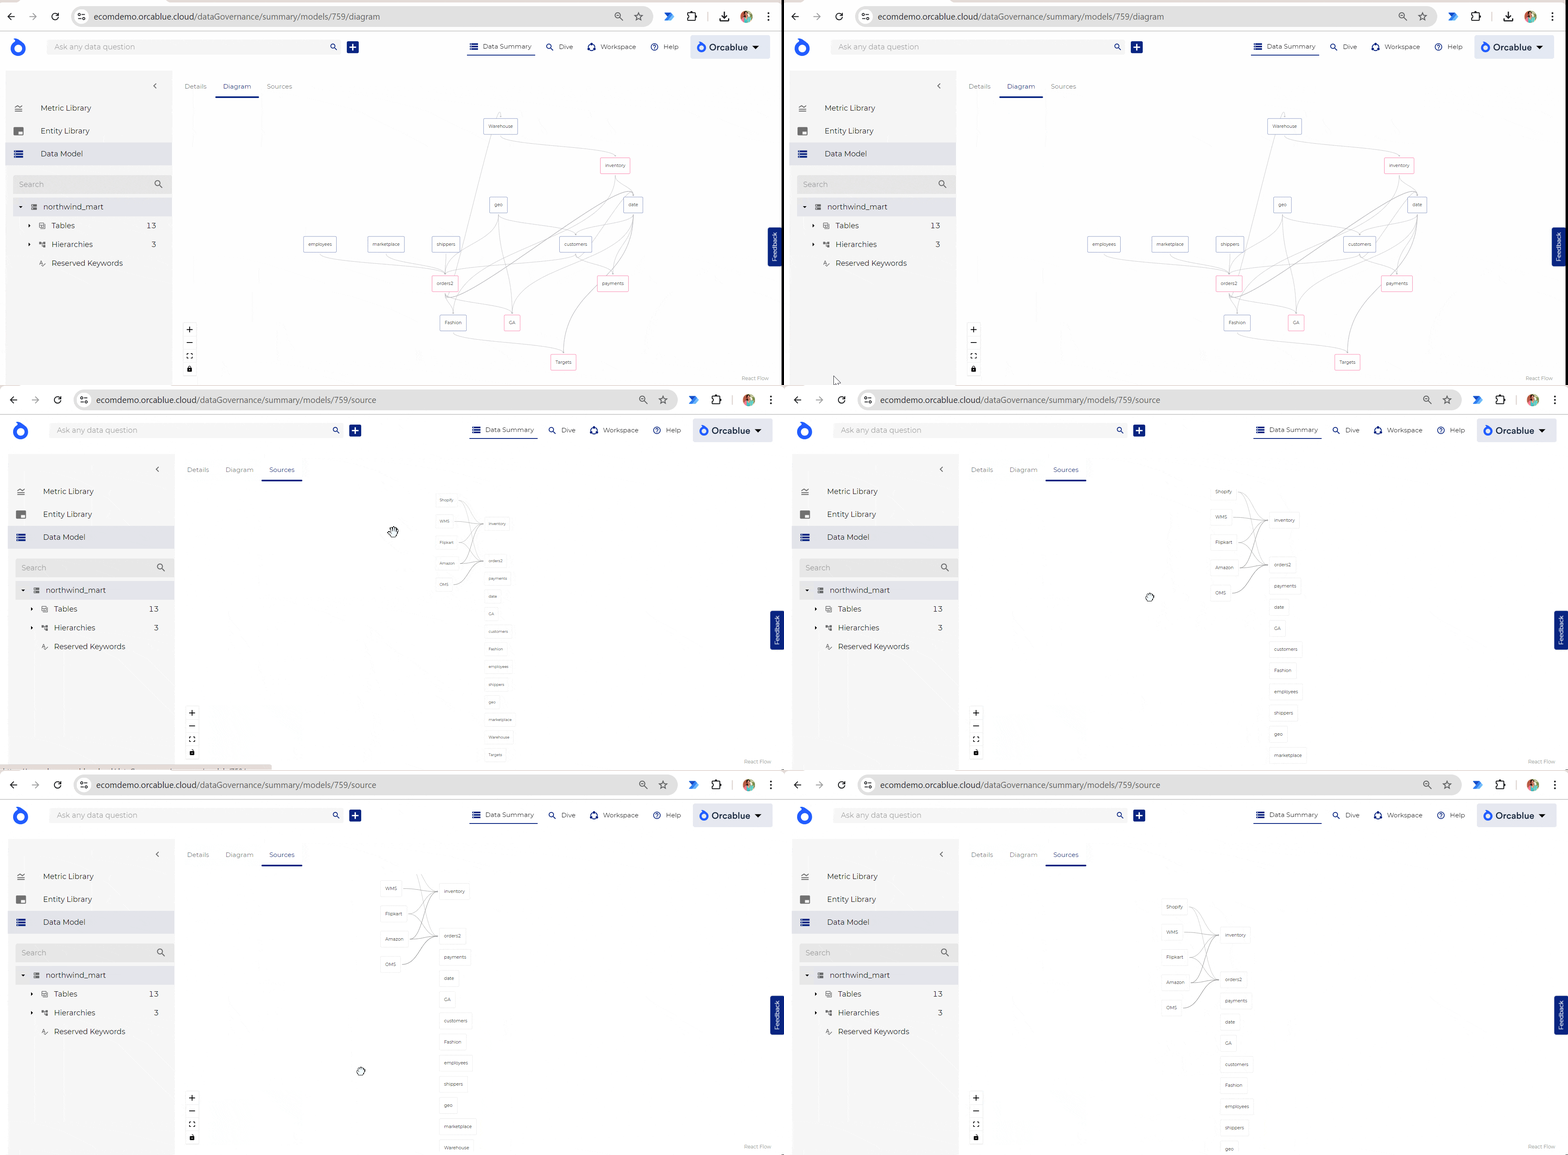
- Data Sources - Data Sources are the origins of the data, feeding into your Data Model. This feature enables you to track the lineage of the data, helping maintain transparency and ensuring that your analysis is based on reliable data sources.
- Metrics - Metrics are the key performance indicators or measures that are analyzed within your data. Metrics are calculated based on the underlying entities and are used to track business outcomes and performance.
- Entities - Entities represent the dimensions or axes of analysis in your data. These are the business elements (such as products, customers, or dates) that metrics are measured against.

Using the Data Model
Navigating the Data Model is simple. The left-hand navigation bar provides a clear, hierarchical structure of the data’s metadata. By exploring the model, you can view the relationships between datasets, how data flows between tables, and where your metrics and entities fit within the broader data architecture.
Each table and relationship is clickable, providing detailed information on how data is structured and connected. This transparency allows you to analyze the lineage of your data and understand how metrics are calculated.
By leveraging the Data Model, you can build more accurate and meaningful analyses. Whether you’re configuring datasets, analyzing relationships, or tracking data sources, the Data Model provides a robust framework for understanding how your data is interconnected.
